Contort, A Playful Plotter
A toy surface plotter where you build math expressions by chaining "nodes" together. Each node modifies the surface in different ways. Designed as a fun little tool that abstracts and helps teach the anatomy of graph equations. It also runs in the web browser!
Tools Used: Vue.js, Vite, Three.js, Typescript, Sass, Figma.
Table of Contents
- Key Features
- Design Inspirations
- The Summer of Math
- Development Timeline
- Stack Overview
- The Conveyor Belt
- Testing for Accessibility
- Open-Sourcing the Project
- Reception
- Other Challenges & Lessons Learned
Key Features
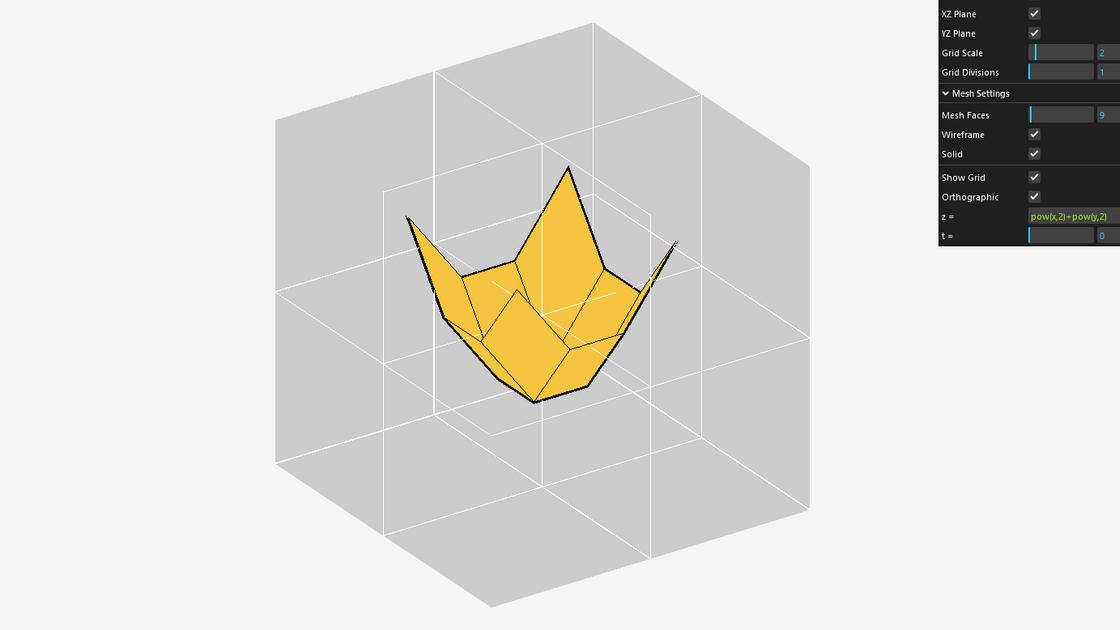
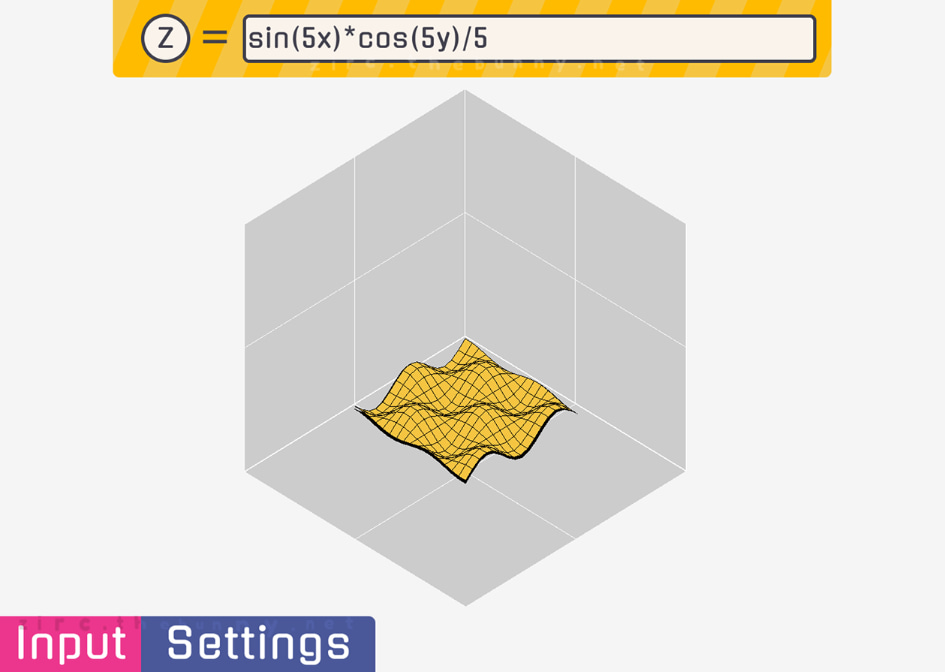
- Chain simple modifiers together using sliders, each applying a different math operation to a 3D surface (visible on-screen).
- Apply custom expressions as their own “node” modifier.
- Export and download the mesh for use in 3D modeling programs (OBJ file format).
- Options for more “advanced” users:
- Reveal the generated equation which the surface is being plotted by.
- Adjust mesh polygon count, grid divisions, and size of the 3D surface.
- Toggle auto-rotation, panning, and mesh wireframes.
Design Inspirations
I was inspired by Studio Playfool’s “play-based” design philosophy and really wanted to try it out for myself with this project, which started off as a simple 3D graphing calculator.
I grew up around a lot of Nintendo products from the 2000s and 2010s, I really liked the bubbly and fun designs of their system menus and software from that era. Naturally, that led me to discover Playfool’s youtube channel, where they craft DIY additions to existing products (such as Nintendo Labo and Lego) that closely follow the source material’s colorful and polished design.

I admire these types of designs a lot, and wanted to try making something original with similar philosophy and aesthetics.
It took a while to figure out what exactly I wanted to make, though. My line of thought was to look for something conventionally boring or complicated, and make a “toy” version of it that’s more approachable.
This was around the time I started my final project for Computer Graphics. The requirements were pretty open-ended, so I used it as an opportunity to start fiddling with ideas. I went with a simple graphing calculator made with Three.js and Math.js:
We basically got to choose what we wanted to do as long as it covers some things we learned that semester as we explore a topic or library of choice. I had to write up a whole proposal for it and everything.
I think one of the reasons why I went with a graphing calculator-type project in particular was that we covered tessellation earlier that semester, and I was curious about applying that to arbitrary math functions.
The Summer of Math
The semester eventually finished and I started thinking about where to take my project next. I still hadn’t figured out how to make the idea “fun” yet, so I still went with a basic surface plotter idea. Here’s an early UI mock-up I made showing how that would’ve looked:
After sharing this mock-up with a friend, I told them how the most fun I had with the project thus far was screwing around with sliders and watching how the 3D mesh changed.
I also realized that I had trouble coming up with equations that would produce a cool-looking plot. It would’ve been nice to just have some predefined ones available for me.
So that’s where the idea of turning this into an “equation builder” came from. Like a character creator…but for graph equations.
I came up with some new mock-ups, focusing on the mobile experience:
During this time, the Second Annual Summer of Math Exposition hosted by 3blue1brown had just begun. It was an opportunity to create and submit “math explainers” for members of that community to enjoy. This was the first year that an explicit “non-video” category was introduced.
I hadn’t initially considered participating, but then realized that feedback from other participants and having a more rigid deadline could be beneficial.
Development Timeline

I had a few things going on that summer. One of them was a thing a professor I know likes to run: they have several groups of students get together to work on different summer projects, and they all meet every couple weeks to present their progress. The intent behind this was to emulate an Agile development routine. I took part as a one-man group continuing my surface plotter idea.
Alongside this project, I also wanted to start putting together my portfolio website. I decided that I would toggle between these two projects in order to complete both of them over the summer and keep myself from burning out.
The schedule I set for myself pretty much went like this:
- I treated the time between meetings with my professor and peers as development sprints, they were each two weeks in length.
- I also spent two weeks working on either project at a time (e.g. for a couple weeks, I would work on Contort, then switch to working on my portfolio website for another couple weeks, and then back to Contort, repeat).
- Since I was only presenting Contort at these meetings, I staggered the schedule so that I always worked on Contort for one of the two weeks before a sprint meeting (i.e. one of the two weeks before a sprint meeting were dedicated to this project, while the other week was for building my portfolio website).

This then all culminated to meeting that Summer of Math deadline towards the end of August.
I ended up sticking to this plan quite well! Even managed to complete and submit the project on time.
From this, I learned that having scheduled meets with others and participating in events with rigid deadlines are one of the best ways to keep me on-task and on-schedule.
Stack Overview
On the front-end, the user interface is built with Vue (using the Composition API) to control the underlying Three.js scene. Vite is also used as the development environment and bundler.
For almost a year leading up to this project, I had been learning React and using it in a prior project. My decision to use Vue here was purely exploratory. I wanted to learn another popular framework for my mental tool belt, and see how it compares against React.
This went nicely with the framework / static site generator I chose for my portfolio site: Astro. I learned about it earlier that year and was interested in it’s JSX-like syntax and ability to combine frameworks together. For a site that I’d like to grow with me and the new stuff I learn, it seems convenient that I can add components from new frameworks I’m learning without having to rebuild the entire site. Anyways, back to the stack overview:
I also chose to write my stylesheets in Sass, since I like being able to declare reusable mixins and nested rules to help me write clean and maintainable stylesheets.
For hosting, I decided to give Cloudflare Pages a try to see what it was like.
The service was fairly new at the time with a fairly generous “free” pricing tier. I didn’t need any back-end functionality here, so a Jamstack cloud hosting provider seemed sensible for my project. I also had access to some nifty analytic features to see where traffic was coming from after I shared the URL around.
In the future though, I would like to migrate hosting over to Github Pages since I’m open-sourcing the project. Having hosting handled in the same place as the source code repository would make it easier for contributors other than myself to maintain.
The Conveyor Belt

Probably the most intricate (and vital) component is the interface that represents the chain of modifiers / functions applied to the surface plot.
It is a chain of buttons (or “nodes” as I’ll be calling them in this context) that appear as you add modifiers to the plot from the menu, you can think of it as a conveyer belt of functions that are applied as the initial graph expression passes through them.
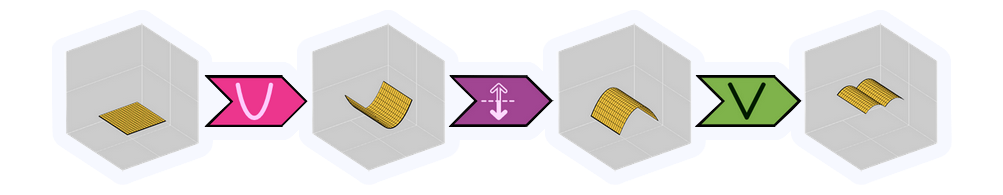
These node buttons also function like tabs. When you click on one of them, it will open a page for editing the specific settings saved for that node (such as slider values and toggle button states). I call these “modifier pages”.
This might’ve been easier to implement if Vue’s built-in KeepAlive component allowed me to customize the caching strategy to preserve modifier page instances and their settings only while they exist on the chain and haven’t been deleted by the user yet.
Unfortunately, the only option given to me by <KeepAlive> was a LRU (least recently used) cache. Using this built-in component left me with two problems:
- Using the LRU cache (by specifying a maximum number of cached instances through the
maxprop) does not give me control on which instances to discard; it might get rid of an instance that was still being used within the chain. - If I chose not to use the LRU cache by having no maximum limit, any “deleted” modifiers would never be truly discarded from the cache, and could cause performance issues if the user creates and deletes a bunch of them.
It didn’t seem like I was gonna have much luck with <KeepAlive> to achieve what I wanted, so I subscribed to a relevant open pull request on the Vue repository and moved on to my alternative solution.
What I ended up doing was store individual modifier page settings in an array declared outside of the component (managed by their common parent: the main GUI component). Without a <KeepAlive> cache, I can’t rely on slider and toggle states to persist across these page instances.
This was tricky, because then I had to figure out how these settings can even be accessed and updated by the relevant Vue components.
Vue does allow a two-way binding for components using a special v-model prop, normally this is used for custom input components. However, I figured out how this prop can be used to allow modifier pages access to the current state of their settings, while also updating them for their parent component.
Not sure if I can explain it any better, but you can check out the commit where I start implementing this solution (and the two or three that follow) if you’re interested.
Testing for Accessibility
This was probably one of the first projects where I used a testing tool to spot accessibility issues on the website. Since I was publishing this project publicly, it was important that I gave accessibility a lot of thought and attention, even if I’m still sorta learning the ropes of it.
Something that surprised me while using Firefox’s built-in tool was that two labels were expected for the icon buttons I made: one for the SVG icon, and one for the button itself. This was where I learned I needed to use the aria-hidden attribute to hide the icons from screen readers to remove that redundancy (as only the label for the button was needed).
Reduced Motion
I also figured out how to check the user’s motion preferences and initialize the 3D scene without auto-rotation if reduced motion were enabled. The prefers-reduced-motion media query is also used in the Sass stylesheets to disable animations and transition effects across all components.
Open-Sourcing the Project

To make sure I could finish Contort in time for the Summer of Math deadline, I needed to make sure I could ship it with all the essentials done first before I moved on to any “nice-to-haves”.
That being said, there were a lot of “nice-to-haves”.
Furthermore, I know there are people out there with far more expertise in graphing than I have who would love to add some more comprehensive features I didn’t consider putting in, myself. It would be nice to have some domain experts come in and help sand this project out into an even better educational tool (and toy) than it currently is.
This is why I chose to open-source Contort, which meant I had to make sure that:
- The initial work I put in is properly respected and attributed. Licensing under the AGPLv3 (and CC-BY-4.0 for assets) would help make sure of this.
- People know how to contribute. I added a
CONTRIBUTING.mdfile which details important steps for adding new modifiers and selecting the right colors. - Adding new modifiers is convenient. I wrote the modifier components with enough configurable props to abstract most of their functionality away and provided a very simple template component to copy and edit from.
- Visitors can see what features are planned for the future. I included a
TODO.mdfile in the repository, which has a checklist of post-release goals I had planned. I also included issue templates for organized tracking of bug reports and feature requests in the future.
Reception
After submissions for the Summer of Math Exposition have closed, they enter a community peer-review process to narrow down submissions for Grant Sanderson (3blue1brown) and his colleagues to personally review. Contort landed among this top 10% of submissions.
However, the project was not among the final pool of winners selected for a prize, but to quote Grant in his mass email to the top 10%:
“Clearly what you made has resonated with the participants in the peer review, so you should be proud of that.”
And I really do feel like I accomplished something for making it this far, which I don’t think I’ve experienced before with an event of this scale. I got to see the positive impressions it made on people in real-time as I shared it on Discord and to peers at those “sprint meets”.
I remember someone mentioning how much faster it ran compared to a lot of other online 3D Surface Plotters that they’ve been using for classes. Was pretty cool to think about, despite the scope being quite different from those fully-featured surface plotters. I think Contort has its place as a “simple 3D graphing tool I can quickly pull up on my phone” among its other use-cases.
Heck, I even used it to graph and troubleshoot equations from the shader I was working on for my website around that time.
Now, I don’t know if I’m really allowed to just post Grant’s email in full here as proof of the top 10% status? If you really need to see that proof for some reason, you can email me about it I suppose. Contort can be found among the official list of entries here, though.
Other Challenges & Lessons Learned
This was my first publicly-shipped single-page application, and I’m really proud of how it turned out. I’d say it’s a nice culmination of things I’ve learned over the prior years (both from college and self-study) that made it possible. Some additional things I’d like to add about the experience include:
- Spending a LOT of time researching licenses and figuring out a good enough fit for this project. I definitely have a greater awareness of the different options now after reading through various comparisons and studying how the various open-source projects I knew of handled their licenses.
- Lots of little quirks with iOS Safari I had to deal with. Things appeared as intended on Firefox, Chrome, and Android, but viewing the site on Safari allowed some overscroll and zooming behaviors I haven’t quite figured out how to resolve. Even
overscroll-behavior-y: noneanduser-scalable=nocouldn’t help me here. The 3D grid box also wouldn’t show up.- That being said, I made sure that the site was at least usable on iOS Safari. I decided to come back to solving these issues at a later date, as they were minor enough that they wouldn’t impede on functionality.
- Despite how magical it was to use, Vue + Vite was missing some luxuries I would have liked. I wanna write more on this, but for now I’ll leave it as a bullet point summarizing my experience. Configuring VScode to work with Vue was unusual, but manageable. I assume Volar—the recommended language features extension for Vue—is largely to blame. In short, I’ve learned that auto-imports, import aliases, and hover documentation weren’t as elegant as they are for React and Astro out of the box.
- However, I really enjoy the clean single-file component structure and the built-in directives used for quickly writing dynamic and reactive components. There were times were I was left literally dumbfounded over how straightforward some things were to implement in Vue compared to React.

Something I skimped on before the deadline due to time constraints was a proper CI/CD pipeline. I figured I would worry about it after I shipped the project out the door, and while the codebase is still relatively small and manageable. It’d probably be a whole project on its own.
I do think it would’ve been nice if I learned how to write tests for Vue projects early on though, because now the task seems a lot more daunting, haha…
Something to keep in mind for next time, I suppose. I’d like to make sure I have at least some groundwork for tests in the early stages of my web projects from now on.